Histogram, Waveform Monitor, & Vectorscope
[ Lecture Notes ] [ Lab ] [ Homework ]
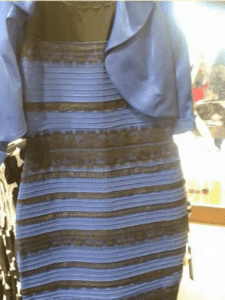
When judging the color and/or tonality of an image on a screen or viewfinder, it’s a good idea to be suspicious of the accuracy of the hardware, and even your own eyes.
After all, even if your hardware is perfectly calibrated, and even if your eyes are extremely well trained, sometimes your brain, in an attempt to fill in missing contextual information, will add a layer of mental subjectivity on top of physical reality:
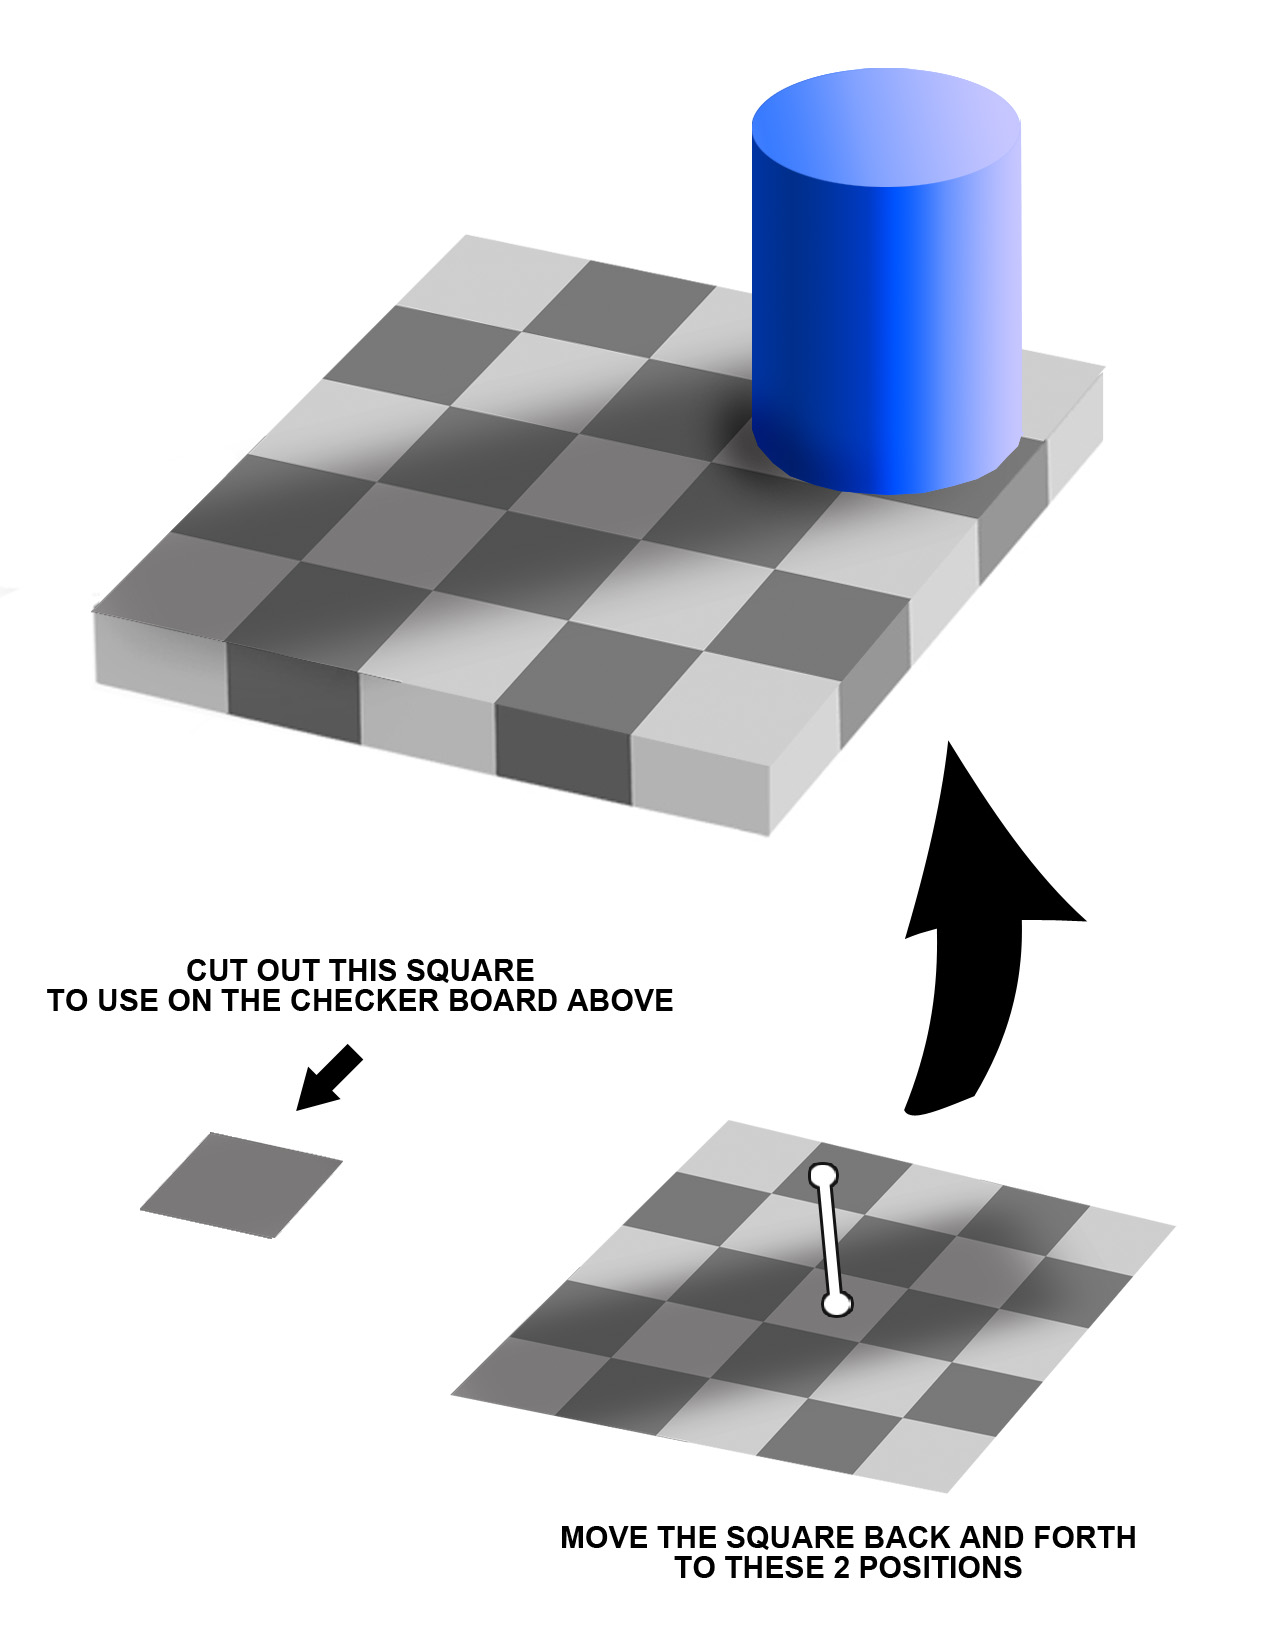
Therefore, it’s a good idea to use various tools like the histogram, waveform monitor, and vectorscope to take a cold, hard look at what’s going on in our footage.
In After Effects and Premiere, these displays and scopes are provided in a panel called “Lumetri Scopes”. And, the associated effect for manipulating color and luminance (in both programs) is called “Lumetri Color”.
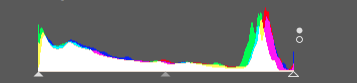
Histogram
This graph is almost like a “vote tally” of the various brightness levels in the image. For the horizontal version, pure black pixels are tallied up on the far-left side, pure white pixels are tallied up on the right, and all other brightness values are tallied in between.
The vertical version in the Lumetri Scopes is similar, but with darks at the bottom and brights at the top.
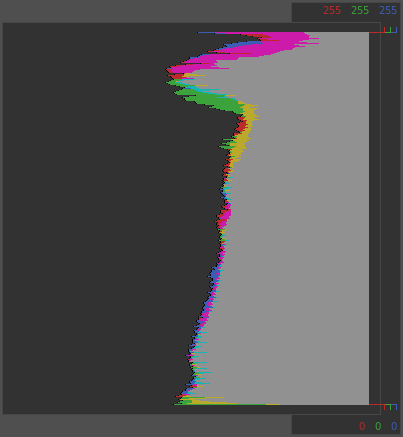
A histogram can help you quickly see how dark your blacks are, how bright your whites are, and how the shot’s information is distributed from dark to light. Knowing where the bulk of an image’s “info” is stored can help when doing targeted corrections.
Waveform Monitor
Used to evaluate the brightness (shadows, mid-tones, highlights) of your image. Similar to a histogram, but instead of displaying a “vote tally” of all the various brightness values for the image as a whole, the Waveform Monitor presents (sort of) a mini histogram for each vertical line of your image.
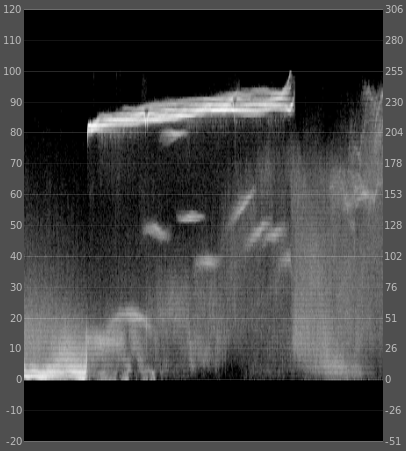
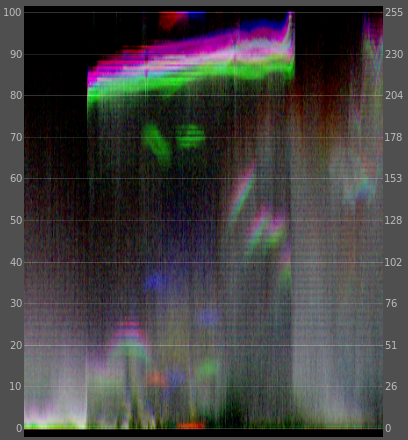
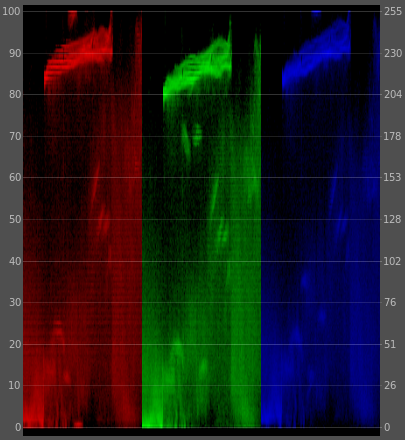
Unlike the Histogram, the Waveform Monitor displays a semi-recognizable version of your image allowing you to still be able to recognize specific features (such as faces for example) within the albeit abstract graph.
Vectorscope
Used to evaluate the color (hue, saturation, etc) or chrominance of your image. Can also be used to evaluate white balance.
This is a radial graph of color saturation. (You might really impress someone at a party if you know that the decorations within the vectorscope is called its graticule.)
The normal color hue wheel is distributed around the circle in a somewhat odd shape, with blue at roughly 3 O’Clock, yellow at roughly 9 O’Clock, and so on.
The center of the circle is zero saturation, which includes black, white, and all shades of gray in between.
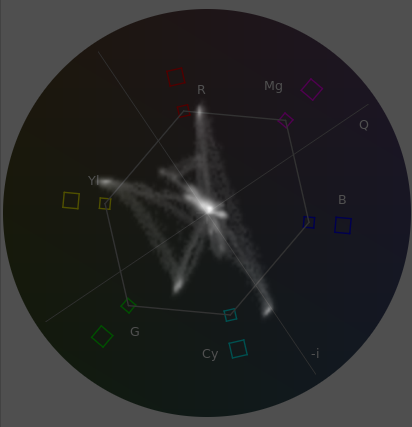
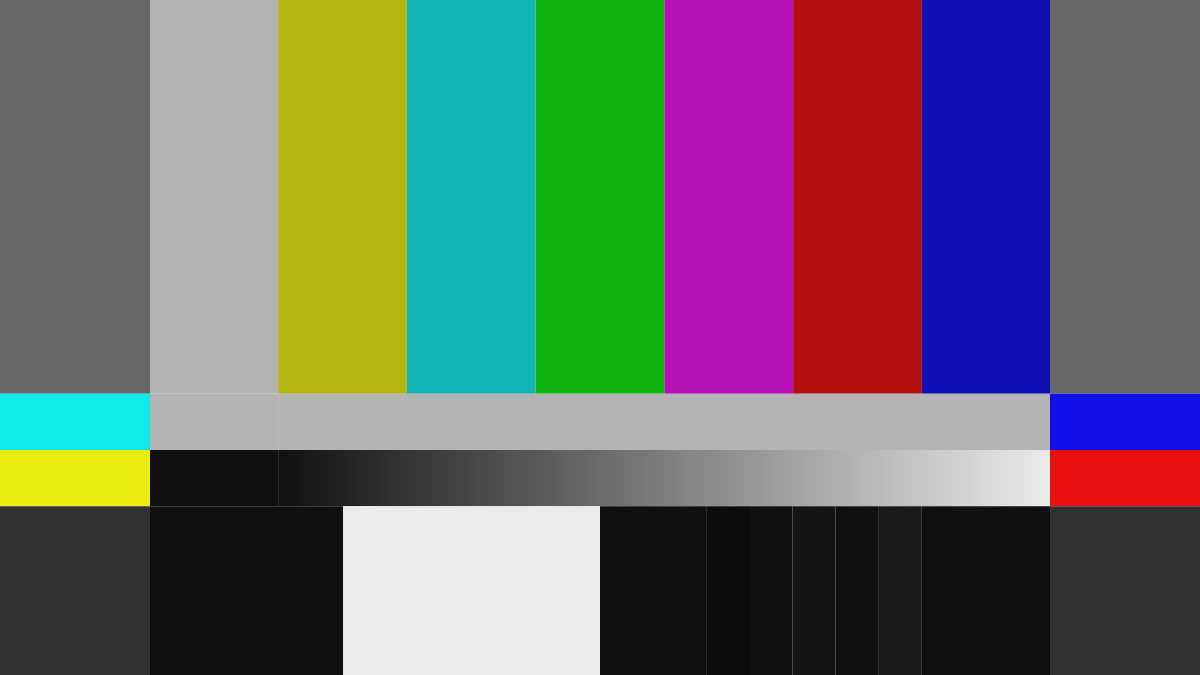
The different colored squares in the circle represent where colors from standard color bars test pattern would go.
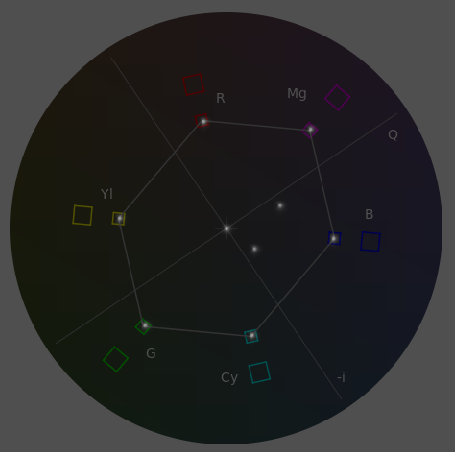
The diagonal line going from the center of the circle up and to the left (to around 11 o’clock or so) is a line showing where human skin tones should be in neutral (non-stylized) footage.